On This Page
Count the complete installed load
Start by establishing what the manufacturer's quoted aircraft weight already
includes. A bare airframe weight, a ready-to-fly weight with batteries, and a
maximum takeoff weight describe different things. Subtracting incompatible
definitions produces a misleading payload allowance.
Mass remaining under the takeoff limit = applicable maximum takeoff mass −
ready-to-fly mass before the proposed payload installation.
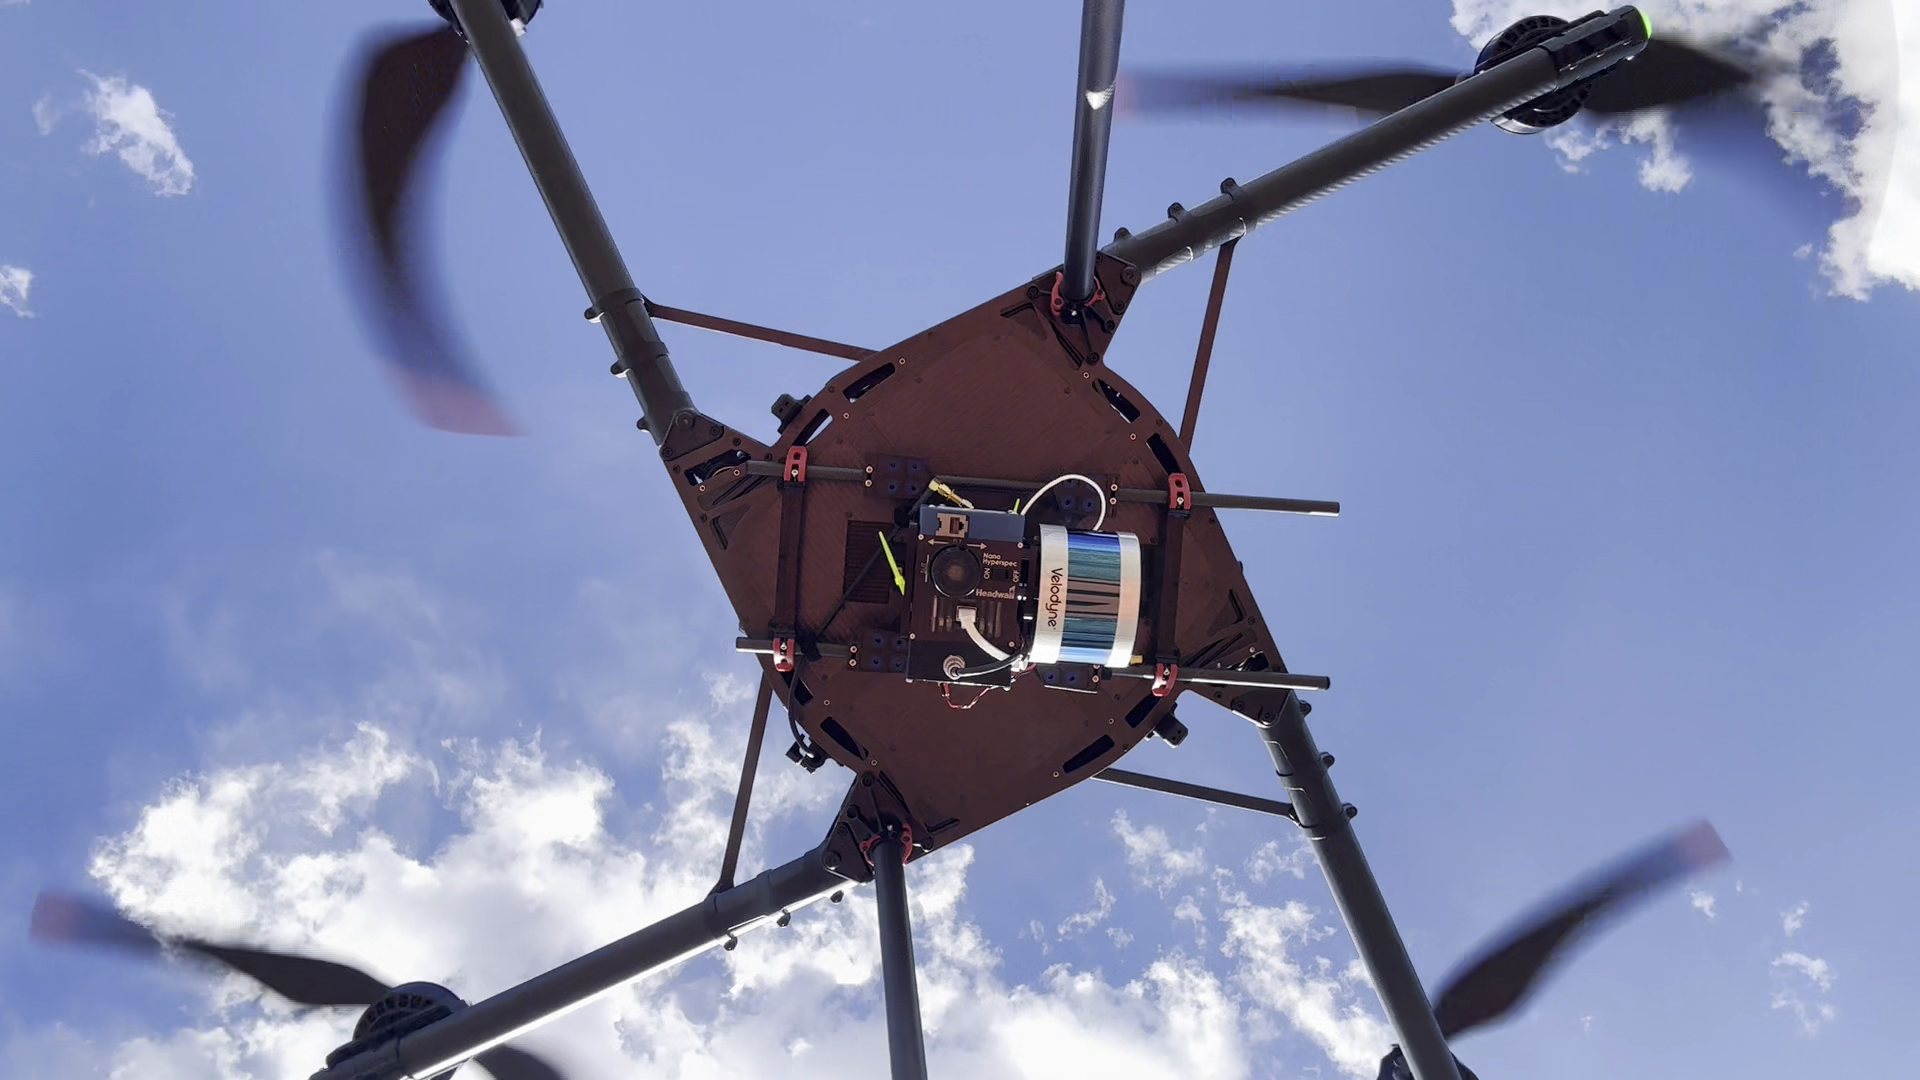
The proposed installation must account for the sensor, lens, gimbal or fixed
bracket, vibration isolation, cables, adapters, onboard computer, enclosure, and
any separate payload battery. Count each item once. Then check the relevant
mount and balance limits even if the total passes.
One aircraft can have several different weight limits
DJI's
Matrice 350 RTK specifications
illustrate the distinction. They list approximately 6.47 kg with two TB65
batteries and a single downward gimbal, a 9.2 kg maximum takeoff weight, and
a 960 g maximum payload for the single gimbal damper. The subtraction leaves
about 2.73 kg under the takeoff limit. It does not permit hanging that
entire mass from the one damper.
The same page lists lower takeoff-weight conditions for its maximum-altitude
figures. A maximum payload and a maximum operating altitude must therefore be
checked as a combination, rather than assumed to apply simultaneously. These are
manufacturer specifications, not a load approval for a custom installation.
Use the aircraft's specified center-of-gravity envelope and mounting
instructions when locating equipment. Also check ground clearance and the
sensor's viewing area. Our
drone payload integration checklist
covers the wider mechanical, electrical, and data-interface work once the mass
budget is established.
Why added weight reduces endurance
A hovering multirotor must produce thrust equal to its weight. Adding a payload
increases the power needed to support the aircraft even when the sensor itself
is switched off.
Rodrigues and colleagues'
research on quadcopter energy consumption
gives an ideal hover relationship: induced power is proportional to total mass
raised to the power of 1.5 when air density and total rotor area remain
constant. Induced power is the aerodynamic power associated with generating
lift, not the aircraft's complete electrical demand.
For an illustrative mass increase from 8 kg to 9 kg, the ratio is (9 ÷ 8)^1.5 ≈
1.19: about 19% more ideal induced power. This calculation is not a
prediction of a 19% flight-time loss. Motor and propeller efficiency, other
electrical loads, and the flight profile still matter.
The study separates takeoff, cruise, and landing rather than treating every
airborne minute alike. Its experiments used one quadcopter platform, so its
measured results should not be transferred directly to a different aircraft. Ask
for performance data for your installed configuration and route.
Two proposed upgrades deserve particular scrutiny:
- A larger battery: it adds energy and mass. Compare the resulting mission
duration using a supported battery configuration, rather than assuming extra
watt-hours translate proportionally into extra minutes.
- A larger external enclosure: assess its effects during forward flight as
well as hover. A weight-only comparison leaves the aerodynamic change
unresolved.
Power capacity is a separate limit
An aircraft can carry a sensor's weight and still be unable to supply its
electrical demand. Establish the payload's input-voltage range, continuous draw,
startup peak, duty cycle, and any heater or computer load. Match these to the
exact port, converter, and wiring arrangement.
DJI's
Payload SDK hardware documentation
specifies the M350 RTK E-Port VCC output as 24 V, limited to 4 A, for 96 W
total. Its VCC pins share a network; they are not independent supplies that
can each provide 96 W. Development-kit output rails have their own limits. Do
not confuse the aircraft port rating with the rating of a downstream 5 V or 12 V
output.
Consider an explicitly hypothetical integration: a sensor draws 60 W and its
companion computer draws 20 W. If both are supplied through a converter
operating at an assumed 90% efficiency, their aircraft-side demand is (60 + 20)
÷ 0.90 ≈ 89 W. That leaves little room beneath a 96 W port rating, and
startup demand remains unknown. The arithmetic is a screening calculation, not
compatibility evidence.
Average watts determine energy consumption over time. Peak current and voltage
behavior determine whether the equipment can operate reliably at all. A separate
payload battery changes that accounting, but its mass must go back into the
aircraft load budget.
Calculate time available for useful work
Battery energy is measured in watt-hours; power demand is measured in watts. A
first-pass duration estimate is:
Estimated airborne time in minutes = 60 × usable mission energy in Wh ÷ average
total electrical power in W.
Define usable mission energy after the planned reserve and applicable battery
limitations. Include propulsion, avionics, payload power, and conversion losses
in the denominator. If measured aircraft battery power already includes the
payload, do not add the payload again.
The following hypothetical planning example, calculated on September 8,
2026, isolates the consequences of two assumed total-power demands. None of the
inputs is a manufacturer rating or a measured flight result. Both cases assume
400 Wh available for the mission after reserve and 8 minutes for takeoff,
transit, return, and landing.
Scroll horizontally to compare all columns.
In this example, a 20% reduction in total flight time produces about 27% less
collection time: (22 − 16) ÷ 22. The fixed travel overhead amplifies the loss.
That does not necessarily mean 27% less completed work: a different sensor may
collect faster or require a different flight pattern. Compare accepted output
per sortie alongside collection time.
For a real mission, obtain power inputs from applicable manufacturer data or
representative flight logs, rather than scaling them from payload mass alone.
Replace the average-power shortcut with segment estimates when conditions differ
substantially. Include sensor warm-up if it uses mission energy, and budget the
return route under the relevant wind conditions. The reserve belongs in the plan
before collection time is allocated.
Published endurance may use a very different boundary. DJI's 55-minute M350 RTK
figure was measured without payload, at approximately 8 m/s in windless
conditions, down to 0% battery. It is not a 55-minute working allowance with a
sensor and landing reserve.
Turn capacity into a commercial deliverable
Start with what the customer must receive: for example, a set of usable
inspection images, a point cloud with specified coverage, or a calibrated
spectral dataset. The payload budget then becomes a constraint on obtaining that
output.
The
USGS guidance on UAS imagery calibration
explains why flight planning, sensor calibration, control, and independent
checks affect mapping quality. Carrying a heavier sensor does not, by itself,
demonstrate that its delivered measurements are better. For inspection work,
define the needed result using the
six levels of drone-inspection evidence
before allocating weight to extra instrumentation.
A useful evaluation proceeds through four steps:
- Specify the collection task. Record the target, coverage, required detail
or accuracy, output format, and minimum useful collection time. Decide how
the recipient will judge the data.
- Freeze the proposed configuration. List aircraft, batteries, payload,
mounts, power conversion, firmware, and software. Record mass, balance,
electrical limits, and unresolved interfaces.
- Evaluate the installed system. Have the responsible integration and
flight team verify power behavior and conduct a representative mission within
the aircraft's operating instructions. Retain configuration details and
flight conditions with the results.
- Inspect the delivered data. Check usable coverage, missing records, image
quality or applicable measurement checks, and processing completeness. Record
rework as well as successful collection.
This configuration discipline follows
NASA's interface-management guidance,
which emphasizes defining, documenting, and controlling the connections between
cooperating systems. Applied here, it means a successful demonstration should
identify exactly what was connected and what changed afterward.
For the trial report, request installed mass in kilograms, payload average and
peak power in watts, mission duration and collection time in minutes, and the
agreed landing reserve measure. Pair those with a useful output measure, such as
accepted asset images or completed area meeting the project's quality criteria.
Record battery condition, weather, and configuration so later comparisons have a
common basis.
Questions to settle before buying
Ask the supplier or integrator for answers tied to the proposed installation:
- What is included in the quoted payload allowance, and what hardware still
needs to be added?
- Which mount, balance, altitude, or electrical limit controls this
configuration first?
- Is the endurance figure for hover or forward flight, and with which payload,
batteries, conditions, and landing endpoint?
- What is the largest startup or operating power demand, including computers and
heaters?
- How many useful collection minutes remain after travel and reserve on the
intended route?
- Can the demonstration produce the actual required files, and which changes
would require another evaluation?
Choose the configuration that produces the required data with adequate working
time and documented operating margins. If it falls short, compare a lighter
installation, separate sorties, a closer operating position where feasible, or a
different platform. Make the comparison on completed work under matched
conditions, with the complete installed payload included.
Source notes
Last checked: September 8, 2026.