On This Page
What the sensor actually measures
The first choice is whether the instrument samples air at the aircraft, measures
methane along a remote optical path, or images gas against a background. The
laser technology name does not settle that question: laser absorption can
support both local sampling and remote measurements.
Local concentration sensors
An in situ instrument measures methane in air at its sensing volume or sampling
inlet. The aircraft must bring that sensing volume into the plume. Some
instruments pump air through a cell; others expose an optical cavity directly to
ambient air.
For example, a
2020 cavity ring-down sensor study
demonstrated approximately 10–30 parts per billion precision in flight. Its open
cavity avoided a pump and flow cell. That is a result for the study's instrument
and conditions, not a specification for all drone sniffers. The authors also
identified rotor-induced plume distortion as a concern for subsequent
emission-rate calculations.
For integration, ask where the gas is sampled relative to the rotors and how the
measurement is time-aligned with aircraft position. Keep output frequency
separate from response time: writing more records does not make the gas
measurement respond faster.
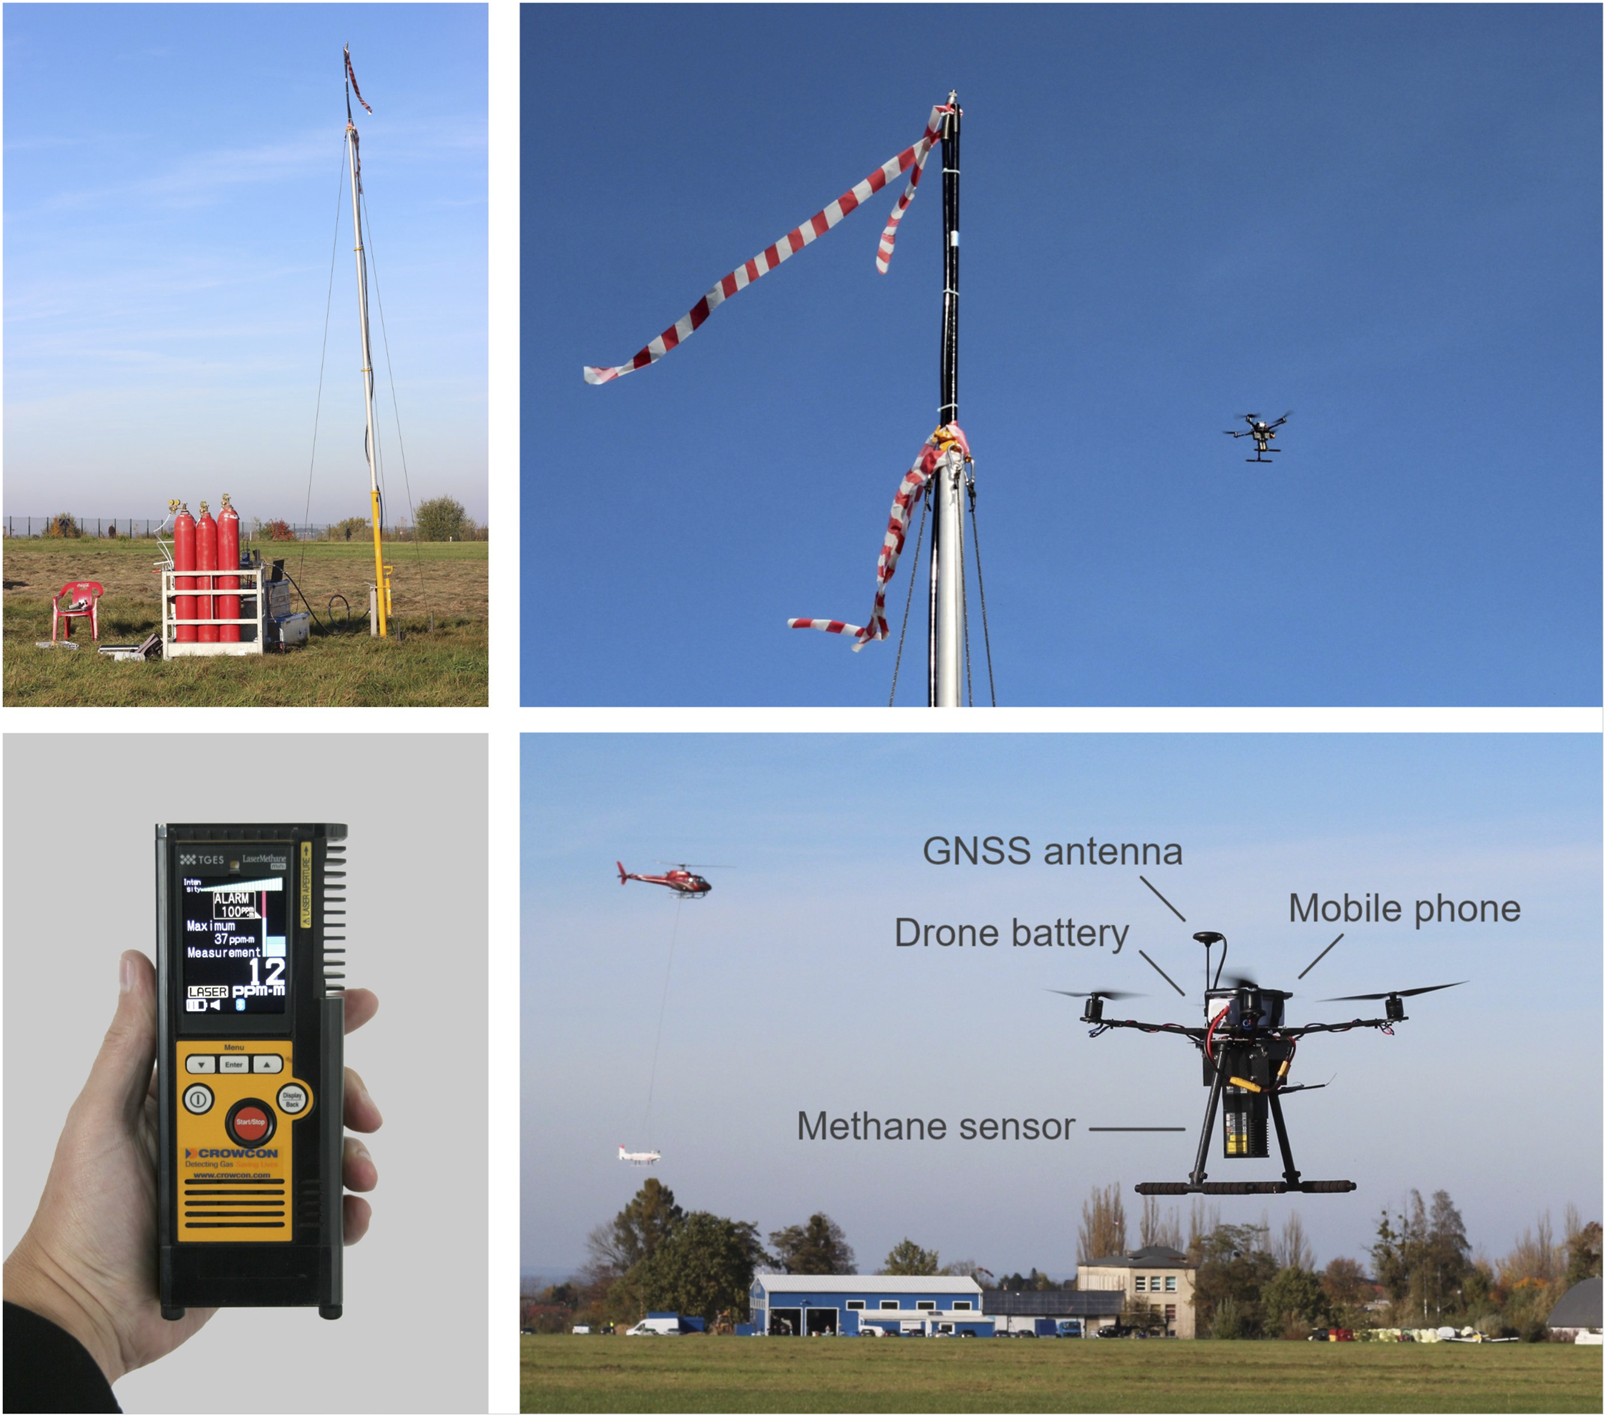
Remote laser measurements
A downward-looking laser can measure methane absorption along the path between
the aircraft and a reflecting surface. It reports a path-integrated quantity,
commonly ppm·m, rather than methane concentration at the aircraft's
altitude.
In
Bretschneider and colleagues' pipeline-leak study,
the drone flew above the expected plume with a downward-facing detector. This
geometry lets the optical path intersect gas while the aircraft remains above
it. Buyers should establish the usable range, surface-return requirements,
pointing geometry, and rejection rules for weak returns before treating a survey
line as covered.
Optical gas imaging
Optical gas imaging, or OGI, uses a camera configured for the absorption bands
of the target gases. An ordinary thermal inspection camera should not be assumed
to detect methane.
FLIR's OGI documentation
describes specialized filtering and different cameras for different gas groups.
Imaging can help an operator see a plume in relation to equipment. Visibility
still depends on the scene:
FLIR's operating instructions
identify focus and gas-to-background temperature contrast as central to finding
leaks. Specify the camera, lens, viewing distance, and usable background
conditions. Treat an emission-rate number as an additional measurement
capability that needs its own validation, rather than an automatic consequence
of seeing gas.
Read detection limits in the right units
These quantities answer different questions. The table separates their meanings
and the evidence to request; the request column is editorial procurement
guidance.
Scroll horizontally to compare all columns.
Source basis: the linked cavity ring-down and pipeline studies establish the
measurement distinction; the controlled-release studies below examine emission
estimates and detection performance. There is no universal conversion from a
sensor concentration threshold to kg/h.
For an illustrative calculation, assume the methane enhancement above background
is uniform along only the gas-containing part of a beam. An enhancement of 5 ppm
over 2 m contributes 10 ppm·m. An enhancement of 1 ppm over 10 m contributes the
same 10 ppm·m. These are hypothetical inputs, not measured leaks. The identical
column reading does not establish identical peak concentration or emission rate.
To estimate mass flow using a flux-plane method, the system combines methane
above background across a downwind plane with wind crossing that plane.
Morales and colleagues used
flights at multiple heights to sample that cross-section. Missing plume edges or
using unrepresentative wind undermines the estimate even if the gas instrument
is sensitive.
Keep instrument precision, minimum observed release, and reliable
survey detection limit separate in a proposal. A single successful detection
establishes that the system found that release in that trial. It does not
establish how frequently it will miss similar releases.
What controlled releases establish
A useful validation report compares the delivered result with a known release
while keeping the true rate hidden from the measurement team until results are
submitted. Zero-release trials reveal false alarms; repeated nonzero releases
reveal missed detections and quantification errors.
The 2026 TADI study
evaluated eight commercial systems in a single-blind campaign. All participating
drone teams detected releases below 0.5 kg/h. However, release start and stop
times were announced, and the authors warned that timing knowledge could
overstate detection capability. They also noted that aerial systems needed more
samples for statistically robust detection-probability characterization. Those
results support capability under the tested conditions, not a universal sub-0.5
kg/h guarantee.
Quantification deserves a separate review. In the Morales study, mean bias was
−1%, while the average residual of individual errors was 54%. A small average
bias can coexist with substantial error on individual flights. Ask for the
distribution of individual errors, not just an average or a correlation plot.
For a buyer-run demonstration, agree in advance on the target release range,
representative site geometry, acceptable weather, and pass criteria. Have an
appropriately equipped test organization manage any controlled gas release.
Include blanks and repeated measurements; distinguish failed surveys from valid
nondetections. Freeze the processing version and require results before the
reference values are revealed.
Your test should answer the purchase question. A screening service needs
demonstrated detection performance and useful follow-up locations. A
quantification service additionally needs bias, repeatability, and uncertainty
results over the rates and conditions you expect to encounter.
Plan the survey around the deliverable
Before mobilization, supply the provider with asset boundaries, an equipment
map, likely release elevations, relevant operating states, access restrictions,
and the intended use of the results. Define whether the assignment concerns
individual components, a pipeline corridor, or a whole facility. Require the
provider to identify what it cannot cover.
For screening, plan valid sensor coverage over the area of interest and a
repeat pass or follow-up process for anomalies. For quantification, require
the method's wind measurements, background observations, and plume-sampling
geometry. The same route need not accomplish both tasks.
A commercial example is
SPH Engineering's documented methane workflow:
it describes importing asset boundaries, controlling height above terrain,
logging sensor readings with aircraft position and time, and exporting mapped
results. These are provider-described workflow functions, not independent proof
of leak-location accuracy or regulatory acceptance.
Set up the data chain before the first survey. Name the recorded clock,
coordinate reference system, altitude reference, gas units, averaging interval,
and quality flags. Require a procedure for sensor checks and any calibration
specified by the instrument manufacturer. Document how tubing delay, if present,
is handled.
Morales and colleagues observed both time lag and smoothing in their AirCore
sampling system. Their correction was specific to that setup. The transferable
lesson is to measure the response of the installed system, rather than copying
another instrument's delay correction.
Confirm mechanical mounting, electrical supply, logging, and usable endurance
with the installed payload. The
drone payload integration checklist
provides the broader interface questions to close before flight.
During collection, retain wind and operating-state records alongside the gas
data. If conditions leave the method's validated range, flag the affected survey
and arrange a repeat or another method. Do not turn an incomplete survey into a
clean bill of health.
Specify a report your team can act on
The following is a suggested purchasing specification. Set project-specific
values before contracting; it is not a claim that every provider supplies these
items.
Scroll horizontally to compare all columns.
A methane plume can be displaced from its source. Record the measurement
location separately from the inferred source location; precise drone positioning
does not by itself prove component-level localization. The distinction is part
of the broader question of
what drone inspection evidence can establish.
Ask for machine-readable data as well as a PDF map. A useful handoff preserves
the readings and their units, timestamps, flags, and processing identity so
another analyst can understand the result. Agree on data ownership, export
access, software charges, and reprocessing rights in the scope of work. Inspect
a sample file in the software your team will actually use before accepting an
export-format promise.
For nondetections, require wording tied to the surveyed area, time, and
demonstrated capability. Keep invalid measurements and unvisited areas visibly
separate. A visit also covers a time window: it cannot establish that an
intermittent source remained inactive between surveys. Likewise, an annual total
extrapolated from a short visit needs an explicit assumption about how emissions
change over time.
Questions to settle before selecting a provider
- What result is included? Identify whether the quote covers screening,
source confirmation, quantification, or a combination, and who performs ground
follow-up.
- Which performance claim matches our job? Request independent results for
the relevant release rates, distances, source heights, weather, and installed
configuration.
- How are unsuccessful flights reported? Require a distinction between no
detection, invalid data, and no coverage, plus clear repeat-survey terms.
- What creates the kg/h value? Ask for the wind method, background
correction, plume-completeness checks, uncertainty definition, and processing
version.
- What will the repair team receive? Inspect an example deliverable for
asset association, location uncertainty, and confirmation status.
- What does the full service cost include? Separate mobilization, field
collection, analysis, repeat visits, exports, and any continuing software
access. Compare quotes against the same deliverable.
Select the method that can demonstrate the required result under your operating
conditions. For early screening, prioritize reliable coverage and a practical
confirmation process. For emissions accounting or comparison between visits,
make quantified uncertainty and repeatable measurement conditions part of the
contracted work. The most sensitive detector is only one part of that decision.
Source notes
- Martinez, Miller, and Yalin, Cavity Ring-Down Methane Sensor for Small Unmanned Aerial Systems (2020).
Primary sensor research documenting in-flight precision, sensing geometry, and
integration limitations.
- Bretschneider et al., Concepts for drone based pipeline leak detection (2024).
Primary modeling and flight research explaining path-integrated measurements;
Figure 5 supplies the featured documentary image.
- FLIR, Optical Gas Imaging.
Manufacturer explanation of gas-specific optical filtering and instrument
classes.
- FLIR, Detecting a gas leak.
Instrument operating instructions on focus, background contrast, and gas
visualization.
- Morales et al., Controlled-release experiment to investigate uncertainties in UAV-based emission quantification for methane point sources (2022).
Primary experiment covering flux-plane sampling, timing effects, and
emission-estimate uncertainty.
- McManemin et al., Controlled release testing of commercially available methane emission measurement technologies at the TADI facility (2026).
Independent single-blind evaluation with disclosed timing and sample-size
limitations.
- SPH Engineering, Drone Methane Detection for Oil and Gas Facilities & Pipelines.
Provider documentation used for its stated collection and data-export
workflow.
Last checked: September 7, 2026.