On This Page
Decide what kind of change you need to measure
Start with the decision the comparison must support. Finding a newly obstructed
access route, measuring excavation, and tracking a small surface defect require
different observations and different checks. Ask the supplier to name the
smallest relevant feature or movement and explain how it will demonstrate that
the survey can resolve it.
An appearance comparison highlights visible differences between images. A
surface comparison measures geometric differences between elevation grids or
three-dimensional point clouds. A condition assessment interprets those
observations using asset knowledge and, where needed, closer inspection. Avoid
letting those three deliverables share an unexplained label such as “AI change
report.”
Esri's
Compute Change documentation
illustrates the distinction between subtracting continuous measurements and
identifying transitions between classified categories. Neither operation, by
itself, explains why the asset changed. A category transition also needs review
of whether the two classifications are correct.
Use the following table to specify the output before choosing a flight or
processing package. These are editorial procurement recommendations, rather than
promises of any particular system's performance.
Scroll horizontally to compare all columns.
For stockpiles and highwalls, the mining drone inspection guide helps define the
underlying inspection task before adding repeat comparisons.
Build a baseline that the next crew can reproduce
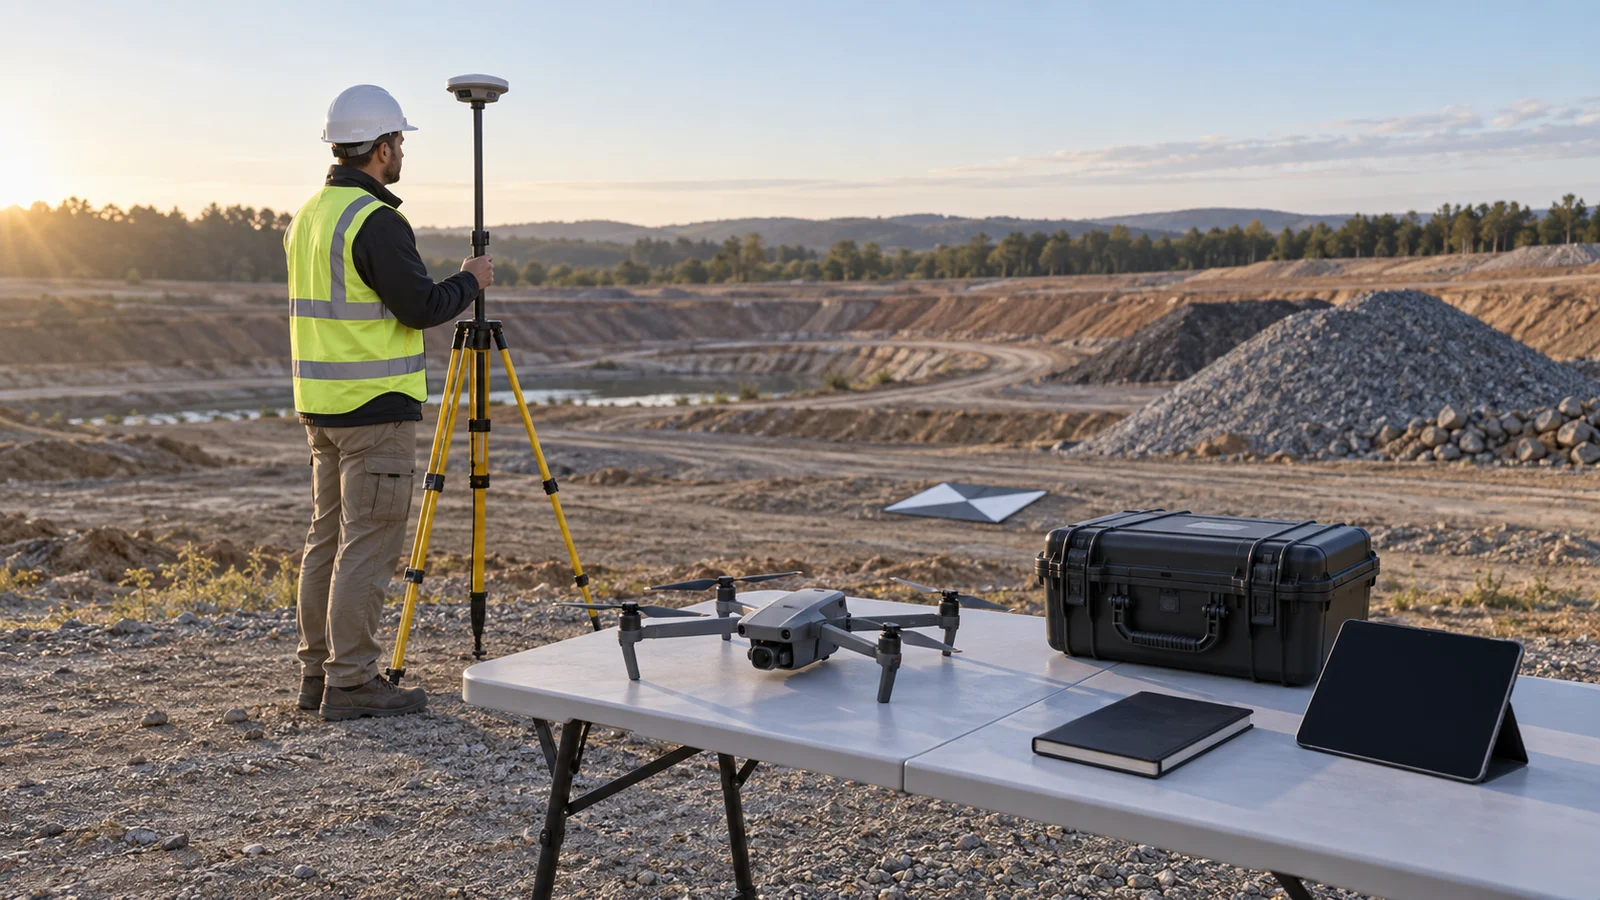
Treat the baseline as a reusable dataset, not just a finished PDF. Retain
original images or sensor observations, capture times, flight coverage, camera
configuration, surveyed references, and processing settings. Record the asset
IDs and boundary used for the comparison so a later crew does not silently
measure a different area.
Specify a common horizontal coordinate reference, vertical reference, and units.
For gridded comparisons, document cell size, grid alignment, resampling, and the
shared footprint. Esri exposes cell-size and extent choices explicitly; these
are analysis decisions, not details to leave undocumented. Mark areas without
valid observations as missing coverage rather than treating them as zero change.
Repeat the viewing geometry and capture conditions as closely as practical, and
record departures. Include a field check of whether the intended surfaces are
actually visible. Do not promise a universal defect size from nominal pixel
spacing alone; require a demonstration using the feature and working distance
that matter to the buyer.
Preserve independent checkpoints as well as any ground control used to constrain
the model. PIX4D's
Open Photogrammetry Format definitions
distinguish checkpoints, which assess quality without contributing to
calibration, from control used in the solution. A small residual at a point used
to fit the model is not the same test as agreement with an independent check.
For procurement, write these obligations into the drone inspection scope of
work, including who maintains reference points and what happens when a reference
is disturbed or inaccessible.
Align the surveys before interpreting the differences
Co-registration means bringing the datasets into the same spatial frame. A
repeat flight route does not demonstrate that the resulting models align. Check
surfaces expected to remain stable, document their distribution around the
inspection area, and inspect the remaining offsets after alignment.
Cook and Dietze's
repeat-UAV survey research
distinguishes comparative accuracy between surveys from absolute accuracy
against an external reference. Their method uses common features in stable
portions of the scene to improve comparisons. That distinction matters
commercially: two surveys can agree with each other without being equally
accurate in the coordinate system used by the owner's other records.
Ask the analyst to identify which areas supported alignment and why they were
considered stable. Keep suspected movement areas out of that reference
selection. Otherwise, the process risks fitting away part of the change you
intended to investigate. If reliable stable references are unavailable, record
that limitation and obtain additional control or an independent measurement
before making a small-movement claim.
For elevation grids, define the sign convention explicitly, such as later
elevation minus earlier elevation. Positive values then mean a higher measured
surface. For a three-dimensional comparison, specify the measurement direction;
a distance measured perpendicular to a local surface is not automatically
vertical settlement or a complete movement vector.
Separate detectable differences from uncertain ones
Require the report to state how uncertainty was estimated and where that
estimate applies. A single project-wide accuracy number can conceal weak areas.
In the
USGS North Core Banks dataset,
the authors qualify accuracy estimates by the bare-ground and low-vegetation
areas used for checks. They also identify vegetation, uniform texture, and
moving objects as potential sources of larger local errors.
Carry such exclusions into the comparison. Use separate labels for detected
change, differences unresolved at the available precision, and areas not
observed adequately. “No detected change” should not be presented as proof of no
change, particularly where the requested feature is smaller than the
demonstrated measurement capability.
A small systematic offset can matter greatly when summed across a site. Consider
a hypothetical comparison with an uncorrected uniform vertical offset of 0.03 m
over 10,000 m²:
Apparent volume difference = 0.03 m × 10,000 m² = 300 m³.
This is an illustrative calculation, not a measured drone accuracy or a project
result. It shows why an attractive volume total is incomplete without alignment
checks and uncertainty. More pixels do not remove an offset shared by the whole
surface.
Keep map filtering separate from volume accounting. Anderson's
research on topographic-change uncertainty
explains that suppressing small differences can be useful for gross erosion or
deposition analyses but can bias net-change estimates. It also distinguishes
thresholding from uncertainty propagation. Ask for the unfiltered result, the
filtered presentation, and an explanation of how correlated and systematic
errors affect the reported total.
Deliver findings that an asset team can investigate
Specify a change register alongside the map. Each entry should have a persistent
asset or location ID, both observation dates, links to the original
observations, the measured quantity and units, the comparison method, and the
analyst's disposition. Separate “requires review,” “confirmed visible change,”
and “requires independent measurement” so the recipient knows what work remains.
Request geospatial files that open in the owner's actual tools, with coordinates
and units intact. Suitable requested formats might include GeoTIFF rasters,
LAS/LAZ point clouds, and a CSV or GeoPackage change register. Confirm the
supplier's supported exports through a sample delivery; do not assume a web
viewer provides the necessary archive or integration.
Keep the inference proportional to the observation. A visible difference can
justify a follow-up inspection without establishing its cause, depth, or
consequence. For a pipeline assignment, use the visual, thermal, and methane
workflow distinctions to define which measurement the finding actually requires.
Do not rename an unexplained image difference as a diagnosed defect.
Before commissioning recurring work, ask the provider to demonstrate one
representative pair of inspections and answer these questions:
- Which specific changes can this capture resolve, and how will that capability
be checked?
- What stable references and independent checks support comparison between
dates?
- Which areas will be excluded, and how will missing coverage be shown?
- What are the sign convention, measurement direction, and uncertainty of each
output?
- Can the owner trace a finding back to both original observations and reproduce
the calculation?
- Who reviews ambiguous results, confirms significant findings, and decides
whether a repeat visit is required?
Accept a recurring service only when that sample delivery answers the owner's
real inspection question. The strongest report makes it possible to distinguish
a measured change, an unresolved difference, and an area that still needs
inspection.
Source notes
- Cook and Dietze, repeat-UAV change-detection workflow:
original research on stable-area co-alignment and comparative versus absolute
accuracy.
- Esri, Compute Change function:
official documentation for raster differences, category transitions, and
processing extent and cell-size choices.
- PIX4D, Open Photogrammetry Format control points:
technical definitions of control, checkpoints, coordinate references, and
associated uncertainty.
- Anderson, uncertainty in quantitative topographic-change analyses:
USGS research record explaining thresholding, net-change bias, and error
propagation.
- USGS, North Core Banks surface-model metadata:
original dataset documentation describing reference systems, independent
accuracy assessment, and localized limitations.
Last checked: September 10, 2026.