On This Page
What the sensors actually measure
A spectral band is a range of wavelengths recorded together. Its position and
width determine which differences in reflected light the sensor can distinguish.
Multispectral bands can themselves be narrow; the important distinction is
selected measurements versus dense spectral sampling, not simply broad versus
narrow filters.
For a concrete example, the standard MicaSense RedEdge-P records five
multispectral bands centered at 475, 560, 668, 717, and 842 nanometers, covering
blue, green, red, red edge, and near-infrared. Its separate panchromatic channel
supports finer spatial output. These are the standard model's bands; the blue
and green variants differ.
The manufacturer's specifications
distinguish multispectral pixels from panchromatic and pan-sharpened pixels.
By comparison, Resonon specifies 281 spectral channels across 400 to 1,000 nm
for its Pika L hyperspectral camera, with a spectral resolution of 2.7 nm full
width at half maximum, or FWHM. FWHM describes the width of the instrument's
response, not the spacing between channel centers. Neither figure is a
ground-position accuracy specification.
Pika L specifications establish this example, not
a performance ranking against RedEdge-P.
Hyperspectral data are often called a data cube: two dimensions locate
pixels across the scene, and the third contains their wavelength measurements.
That third dimension is spectral, not elevation. A hyperspectral camera does not
become a lidar instrument because its output has three dimensions.
The sensor tradeoffs at a glance
Scroll horizontally to compare all columns.
Source basis: the manufacturer specifications above,
Resonon's technical glossary,
and the calibration and research sources below, checked September 7, 2026.
Commercial fit is editorial interpretation, not a measured comparison of two
complete systems.
Wavelength coverage is a hard limit. A camera ending at 1,000 nm cannot
measure a diagnostic feature at 2,200 nm, however many channels it records. If a
proposed mineral or material classification relies on that feature, it requires
suitable shortwave-infrared coverage. The USGS explains how
hyperspectral mapping uses material-specific absorption patterns.
Confirm the target spectra before choosing a sensor; the word hyperspectral does
not specify which spectral region is covered.
How the workflows differ
Both approaches require a capture plan, calibration, spatial alignment,
processing, and checks against observations on the ground. The difference is how
much of that chain is already established for the intended deliverable.
Multispectral: build a consistent reflectance map
For a frame-based multispectral survey, plan image overlap and ground sampling
distance, capture the required calibration images, collect the survey, align the
bands, and create a reflectance mosaic. Then calculate the index or run the
model that serves the job.
Raw pixel brightness is not yet reflectance. MicaSense's
calibrated-panel procedure
first converts raw values to radiance, then uses a panel's known reflectance to
derive a conversion for each band. A saturated panel image cannot provide the
required conversion. Preserve panel observations and capture metadata alongside
the survey, particularly when comparing dates.
A colorized vegetation index can guide scouting, but the colors alone do not
establish the cause of a change. In a
2020 winter-wheat field study,
researchers related multispectral indices to water and nitrogen measurements
using three genotypes at two locations. Ground measurements were part of the
method. The commercial lesson is to validate the crop and trait relationship
locally before converting an index into a treatment instruction.
Hyperspectral: reconstruct and interpret a spectrum
In a pushbroom, or line-scan, hyperspectral system, each exposure measures
spectra along one line across the flight path; aircraft motion supplies the next
spatial dimension. This describes Resonon's cameras. Verify the acquisition
architecture of any other system before applying the same flight assumptions.
The
line-scan explanation
describes how motion builds the image.
For line-scan work, time synchronization and measured aircraft position and
orientation matter because successive lines must be placed correctly on the
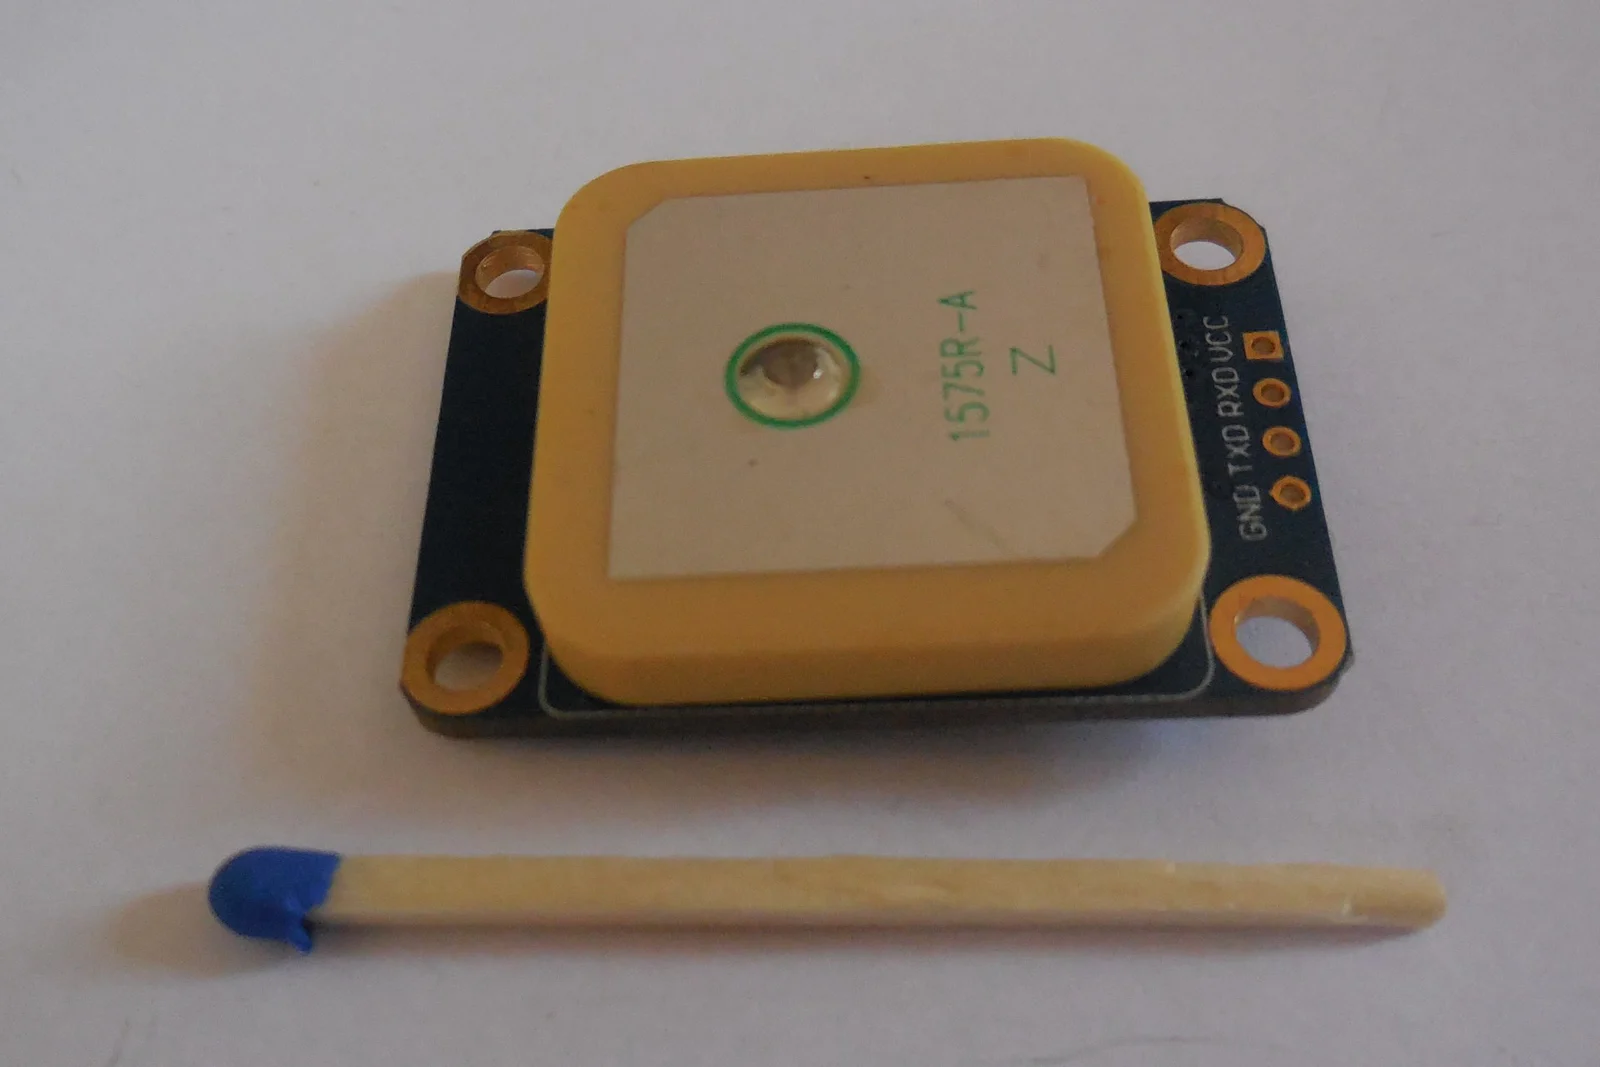
ground. Check the complete payload's navigation and processing arrangement. Our
explanation of
GNSS-aided inertial navigation
covers the relationship between those measurements.
The processing chain typically converts raw values to radiance, derives
reflectance, places the data geographically, screens unusable bands and pixels,
and applies feature selection or a trained model. Resonon's
radiometry guidance
describes reflectance conversion using either measured illumination or a target
with known spectral reflectance. Its illumination-based relationship assumes an
ideal diffuse reflector. Surface viewing geometry and lighting still deserve
attention; a calibration step does not make every scene physically equivalent.
Flight productivity is also conditional. Resonon's
airborne-system guidance
explains that reduced light can force a lower acquisition rate and slower
flight. An attractive coverage estimate is meaningful only with the lens,
altitude, exposure, illumination, and required image quality attached.
What accuracy means in the field
Ask which accuracy the supplier is reporting. These are separate questions:
- Spatial accuracy: Does a mapped feature land at the correct ground
location? Check independent surveyed points or features, not just the
aircraft's positioning specification.
- Radiometric accuracy and repeatability: Do recorded reflectance values
agree with suitable references, and remain comparable between acquisitions?
- Classification or prediction accuracy: Does the model identify the right
class or estimate the required trait on observations it did not learn from?
The first two affect whether the data can support the third. A geographically
precise map can still contain biased reflectance; a clean spectrum can still be
assigned to the wrong class.
Nansen, Lee, and Mesgaran's
2025 methodological study
demonstrates how many explanatory variables and too few observations can produce
misleading classification performance. Its simulations also emphasize
independent validation. More spectral channels create opportunities for useful
discrimination and for fitting incidental patterns.
For a commercial comparison, reserve whole plots, locations, or later
acquisitions for evaluation when those are the conditions the service must
handle. Randomly withholding nearby pixels from the same scene is a weaker test
of transfer to a new field. Require errors by class, including missed targets
and false alarms, rather than only an overall percentage. For continuous
estimates, require error in the quantity's real units and the range over which
it was tested. These are editorial recommendations derived from the validation
problem, not a universal certification procedure.
Pixel mixing can defeat either approach. If the target shares a pixel with
surrounding vegetation or soil, the recorded spectrum combines their
contributions. Small and Sousa's
airborne agricultural-imaging study examines
vegetation indices alongside spectral models that estimate fractions of
different materials within mixed pixels. A finer wavelength grid does not
automatically isolate a small target. Match usable spatial detail and field
conditions when comparing results; do not compare a close-range laboratory
spectrum with an airborne map and call the difference a sensor-class advantage.
Where the cost comes from
Budget for an accepted deliverable, including the work required to establish
that it is correct. A camera-only comparison misses the aircraft installation,
reference equipment, processing, field sampling, and recurring analyst time.
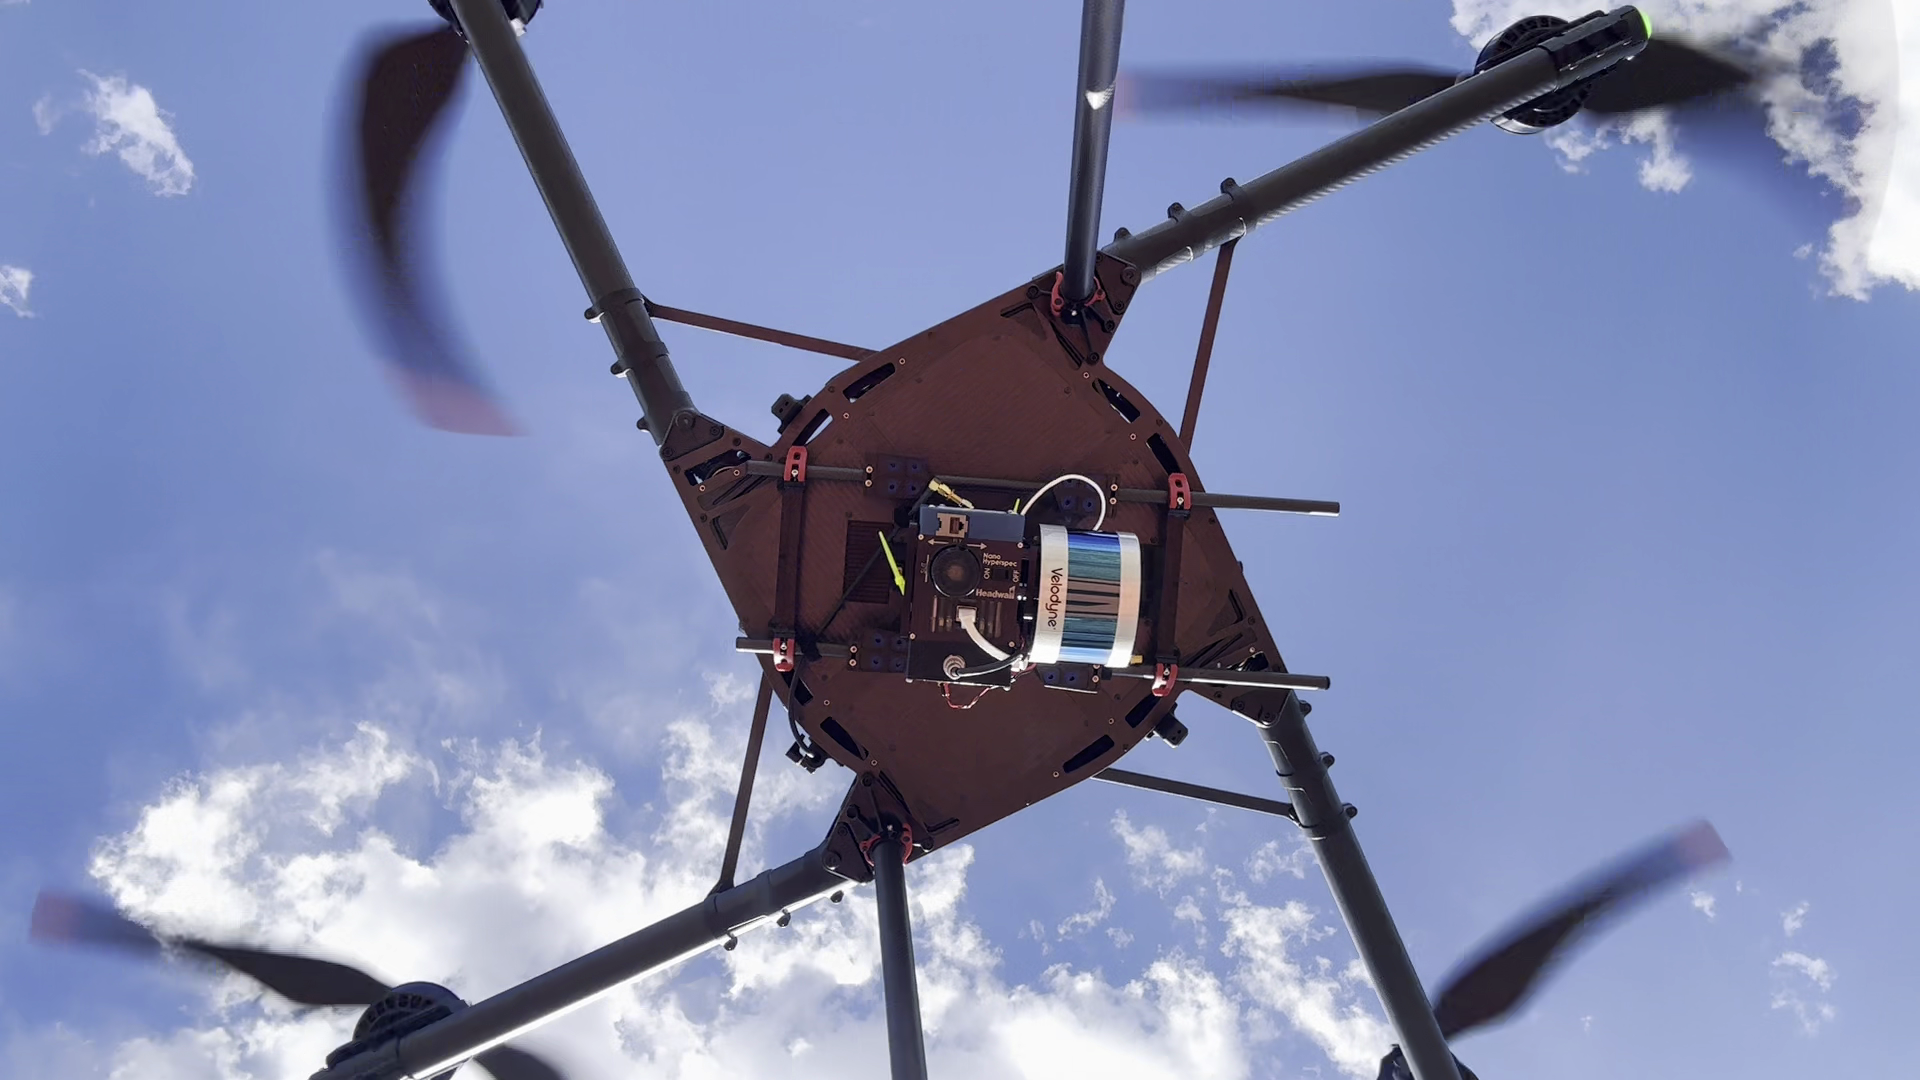
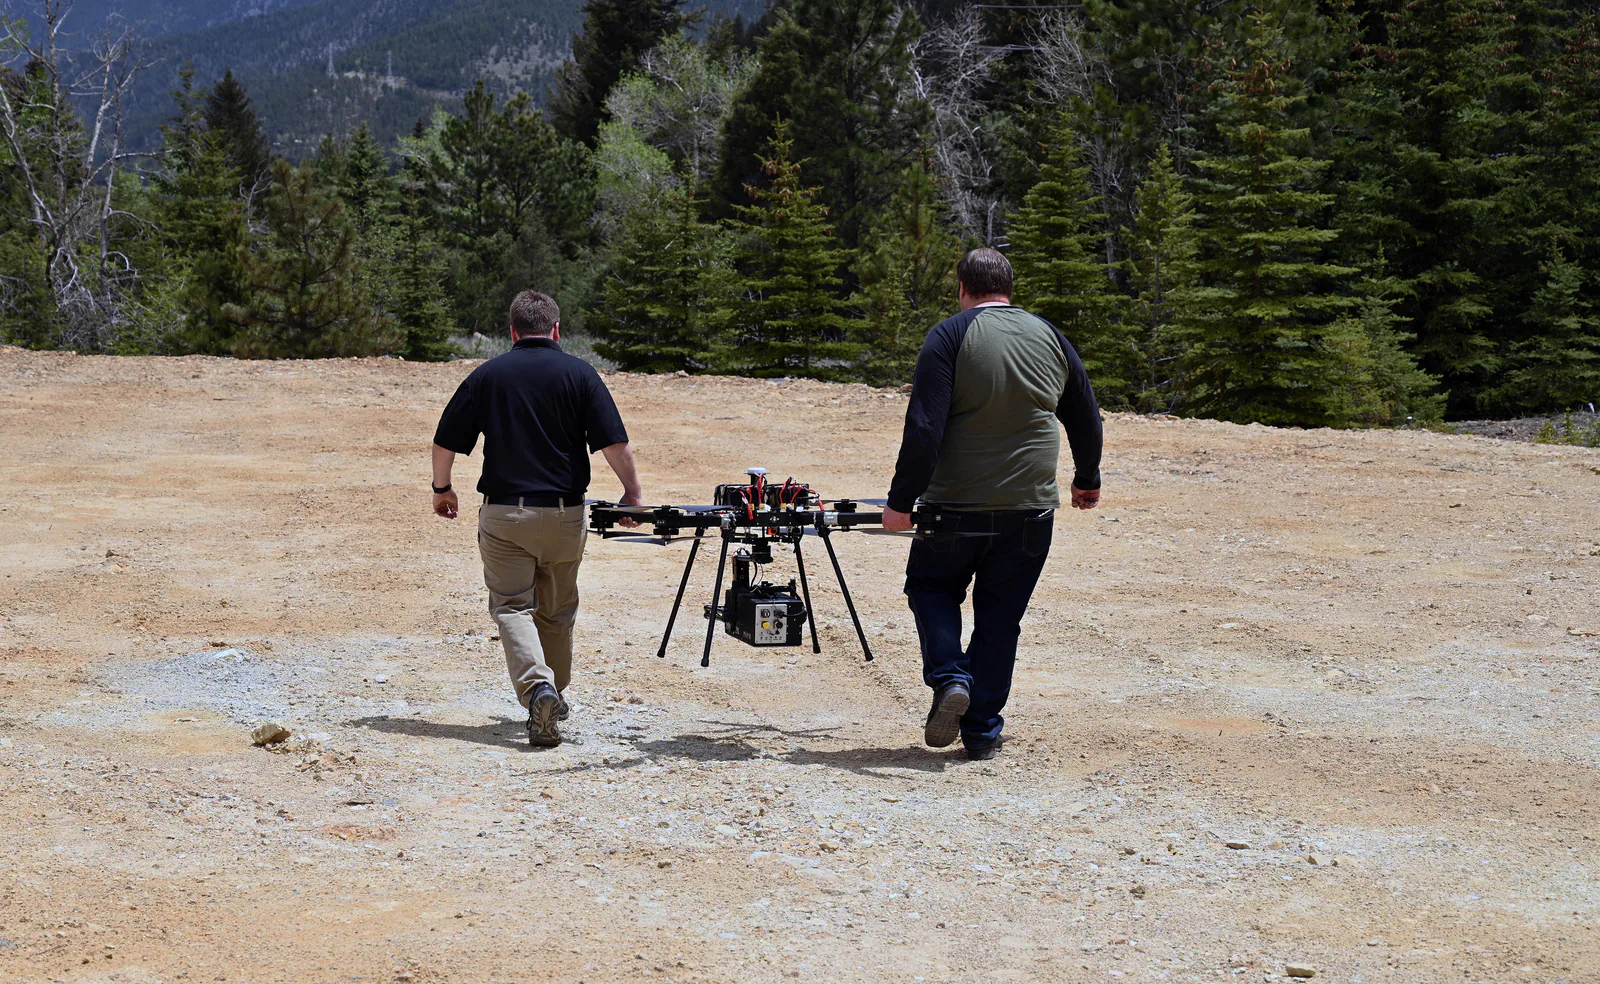
Resonon's airborne package, for example, includes a control unit, navigation
equipment, georectification software, calibration equipment, and analysis
software. Those components explain why camera specifications alone are
insufficient for integration or budgeting. Confirm mounting, power,
synchronization, and data export through the
drone payload integration checklist
before estimating flight operations.
Data volume is a predictable cost driver
Consider an illustrative output grid with 10 million spatial pixels stored as
uncompressed 16-bit values. These are chosen planning inputs, not measured
camera files or a survey-size forecast.
Data size in bytes = spatial pixels × stored bands × bytes per value.
Five bands require 10,000,000 × 5 × 2 = 100,000,000 bytes, or 100 MB. Two
hundred bands require 10,000,000 × 200 × 2 = 4,000,000,000 bytes, or 4 GB. That
is 40 times as much data on the same grid. MB and GB here use decimal units.
This excludes overlap, navigation logs, metadata, backups, and intermediate
processing files; floating-point products or compression change the storage
requirement.
The calculation does not imply processing takes 40 times longer. It does show
why transfer, storage, and memory should be estimated from actual output
dimensions. Request a representative dataset and a measured processing run on
the intended workstation.
For recurring work, compare both methods using the same scope:
Cost per accepted hectare = total project cost ÷ hectares meeting the agreed
delivery requirements.
Include equipment allocation, installation, collection, calibration, processing,
field verification, and rework in project cost. A multispectral workflow may
need substantial model development; a specialist hyperspectral service may
arrive with much of that work established. The useful comparison is each
proposal's total workload and usable output, not an assumed fixed price premium
for hyperspectral sensing.
Which commercial missions fit each approach
Use the table as a starting point for a pilot, not as a promise that a sensor
will produce the desired result. Mission recommendations synthesize the cited
spectral, calibration, and field-research evidence.
Scroll horizontally to compare all columns.
For a service provider already delivering vegetation maps, the first upgrade
question should be specific: which customer decision fails with the present
bands? If no one can name that decision and provide field labels or reference
measurements, collecting a larger cube is unlikely to resolve the business case.
What to require from a pilot project
Before committing to either workflow, agree on the target, output format,
required spatial detail, and the errors that would make the result unusable.
Then commission a matched pilot with representative lighting, backgrounds, and
target conditions.
Ask for the calibrated data, wavelength metadata, processing steps, independent
comparison measurements, class-specific errors or prediction errors, and elapsed
collection-to-delivery time. Require the provider to identify which parts of the
method need retraining or recalibration for another site or season. Keep field
verification in the scope of both proposals.
Choose multispectral when its available bands and established workflow answer
the job reliably. Choose hyperspectral when additional spectral detail
demonstrably improves the decision on independent data and the team can sustain
the collection and analysis burden. If neither pilot meets the intended use,
revise the measurement approach before buying more sensing capability.
Source notes
- RedEdge-P specifications:
manufacturer documentation for the standard model's bands and separate
spatial-resolution outputs.
- Pika L specifications: manufacturer
documentation for spectral range, channel count, and FWHM resolution.
- Hyperspectral Imaging 101: Terminology Glossary:
manufacturer technical explanation of spectra, line scanning, and data cubes.
- Use of Calibrated Reflectance Panels for MicaSense Data:
manufacturer procedure connecting raw measurements, radiance, and reflectance.
- Remote Sensing Radiometry Basics:
manufacturer guidance on illumination, reference targets, and reflectance
conversion assumptions.
- Airborne Hyperspectral Remote Sensing Systems:
manufacturer documentation for system components and acquisition constraints.
- Experimental design issues associated with classifications of hyperspectral sensing data:
2025 original methodological research on overfitting and independent
validation.
- Assessment of Water and Nitrogen Use Efficiencies Through UAV-Based Multispectral Phenotyping in Winter Wheat:
2020 original field research connecting multispectral indices with ground
measurements under specified crop and treatment conditions.
- USGS Hyperspectral Mapping:
government explanation of absorption patterns used to distinguish minerals,
soils, and vegetation; its large-area surveys are not drone-performance
specifications.
- Linking Common Multispectral Vegetation Indices to Hyperspectral Mixture Models:
2022 author manuscript examining mixed pixels in airborne agricultural
imagery; its sampling scale does not establish performance for a particular
drone camera.
Last checked: September 7, 2026.